Technodiversity Glossary
Technodiversity glossary is a result of the ERASMUS+ project No. 2021-1-DE01-KA220-HED-000032038.
The glossary is linked with the project results of Technodiversity. It has been developed by
Jörn Erler, TU Dresden, Germany (project leader); Clara Bade, TU Dresden, Germany; Mariusz Bembenek, PULS Poznan, Poland; Stelian Alexandru Borz, UNITV Brasov, Romania; Andreja Duka, UNIZG Zagreb, Croatia; Ola Lindroos, SLU Umeå, Sweden; Mikael Lundbäck, SLU Umeå, Sweden; Natascia Magagnotti, CNR Florence, Italy; Piotr Mederski, PULS Poznan, Poland; Nathalie Mionetto, FCBA Champs sur Marne, France; Marco Simonetti, CNR Rome, Italy; Raffaele Spinelli, CNR Florence, Italy; Karl Stampfer, BOKU Vienna, Austria.
The project-time was from November 2021 until March 2024.
Special | A | B | C | D | E | F | G | H | I | J | K | L | M | N | O | P | Q | R | S | T | U | V | W | X | Y | Z | ALL
U |
|---|
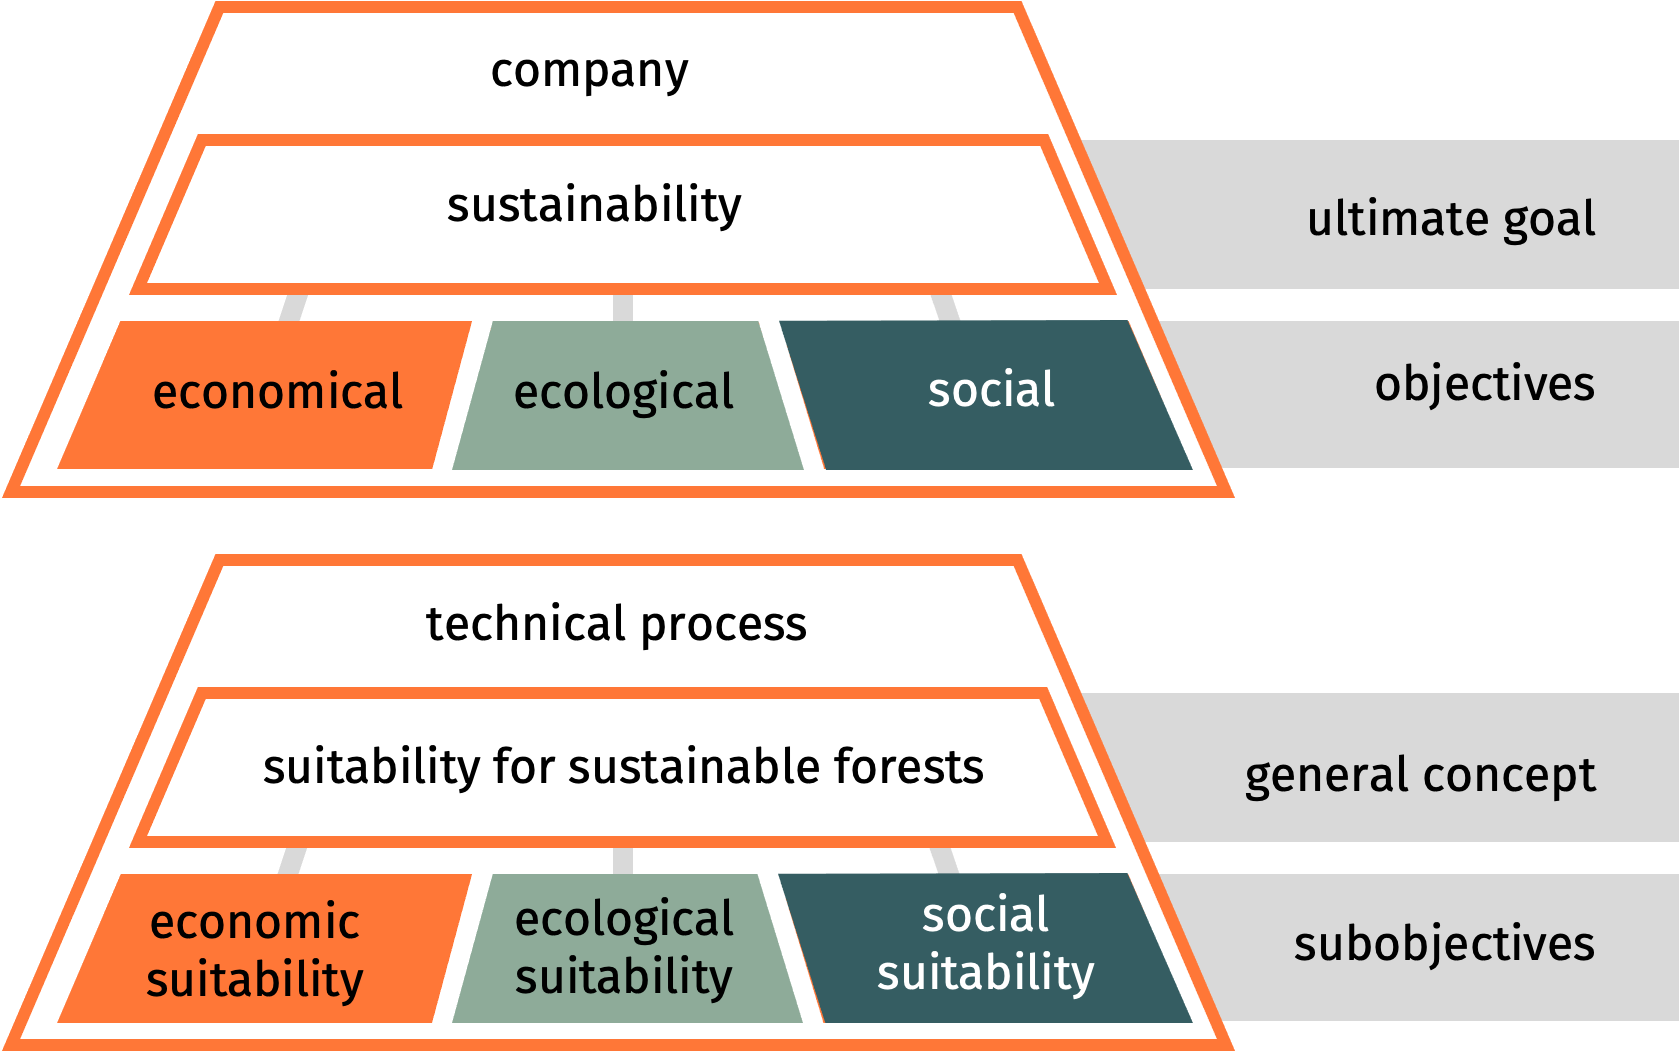
Ultimate goalThe Ultimate goal is an overall concept of a company. It has two dimensions: · For internal decision-making situations it clarifies priorities or preferences between the economic, ecological and social objectives. Thus, it improves the transparency and operationality of the decision-making process. · For external use it explains with simple words the focus how this company sees itself. It can be regarded like a motto that explains the typical behavior of the company. (See more at PR1-A03)
| |
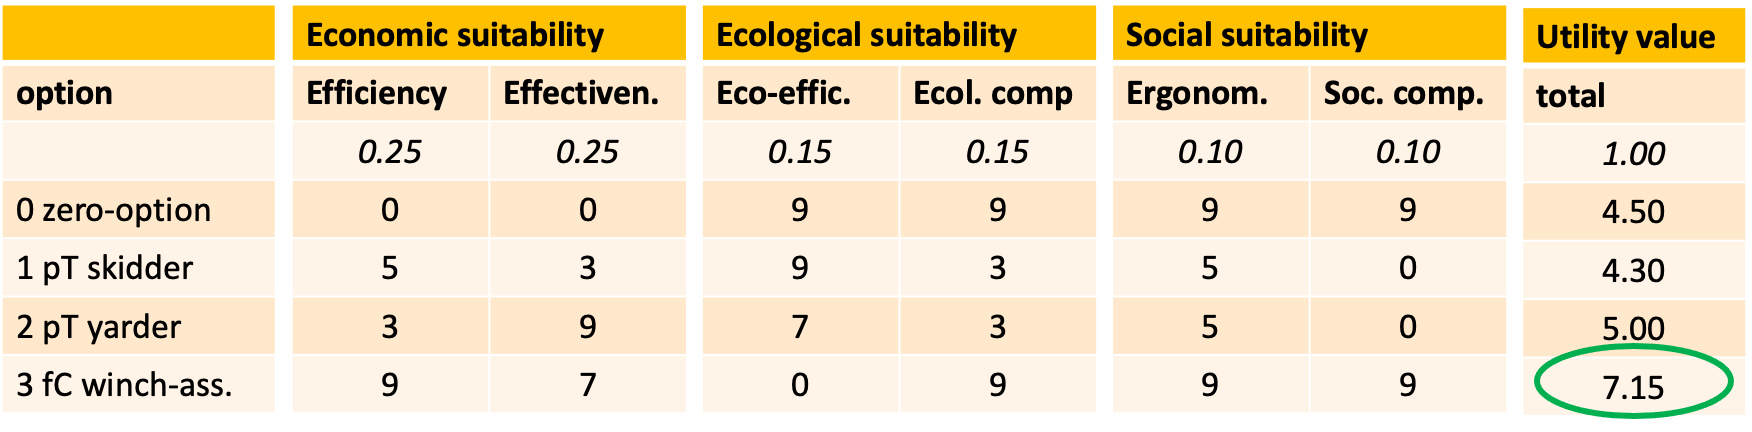
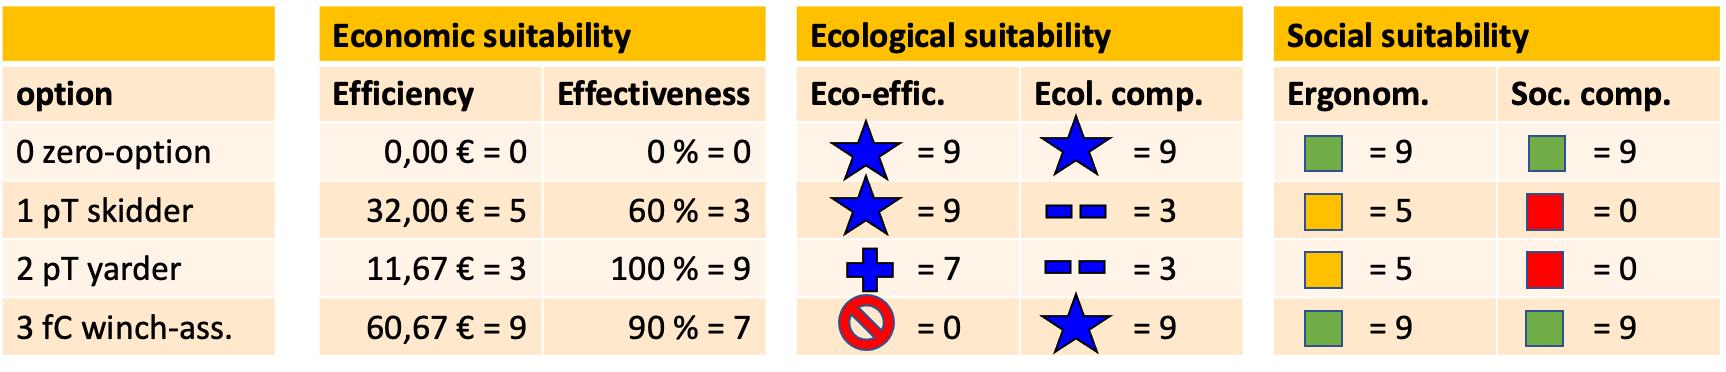
Utility analysisThis is one option to find the best option. Others are the minimax-rule, monetarization, AHP, and optimality curves, for example. This method for decision making is really old (Zangemeister 1973). Here, one common scale of values is used, that is not based on monetary values. Instead, one uses scores like in school. Every criterion must be rated according to those scores.Next, one gives a weight to every criterion according to its relative importance. The sum of weights should be 1.0 Finally, each score is multiplied by the respective weight and then summed up. The option with the highest score will be the favorite. Let’s take an example. Here we introduce a value scale with scores that allow a rough assessment like:
 Then we need some weights for the different criteria. It is easier to weigh the three main pillars first, for example
…and then the two sides of optimality (i.e. effectiveness and efficiency). Multiplying them, you get the weight. In our example we balance effectiveness and efficiency by 50/50 %. 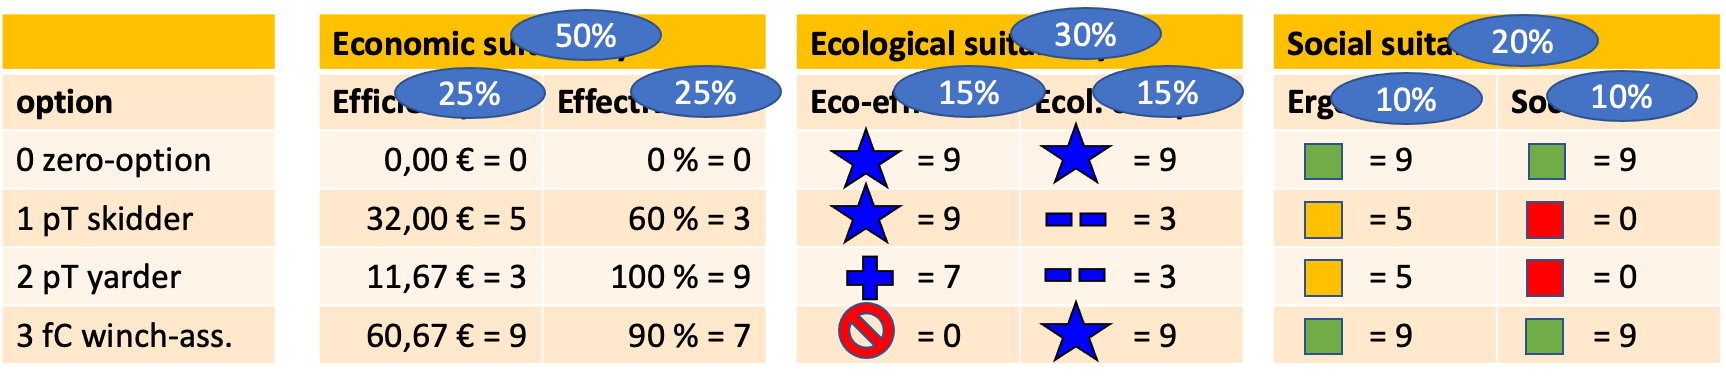 The result is quickly told: again, option 3 CTL (hC winch-assist) wins, option 1 is a bit worst than the zero-option. No option is really bad, but also no option is extraordinarily good (the range of values is between 4.3 and 7.15). This is one of the disadvantages of this method: It equalizes all options near the center.
Scientists do not rate this analytical method too high, because it has a couple of mathematical bugs, that make it unscholarly. One of the most relevant critics at the utility analysis is, that it uses mathematical operations that are not rational. In particular, the scores 0-9 are data on an ordinary scale, which only knows “more”, “equal” and “less”. Operations like adding or multiplying may not be done. But it has one advantage: It allows for a transparent decision-making process. (See more at PR1-F04) | |