Technodiversity Glossary
Technodiversity glossary is a result of the ERASMUS+ project No. 2021-1-DE01-KA220-HED-000032038.
The glossary is linked with the project results of Technodiversity. It has been developed by
Jörn Erler, TU Dresden, Germany (project leader); Clara Bade, TU Dresden, Germany; Mariusz Bembenek, PULS Poznan, Poland; Stelian Alexandru Borz, UNITV Brasov, Romania; Andreja Duka, UNIZG Zagreb, Croatia; Ola Lindroos, SLU Umeå, Sweden; Mikael Lundbäck, SLU Umeå, Sweden; Natascia Magagnotti, CNR Florence, Italy; Piotr Mederski, PULS Poznan, Poland; Nathalie Mionetto, FCBA Champs sur Marne, France; Marco Simonetti, CNR Rome, Italy; Raffaele Spinelli, CNR Florence, Italy; Karl Stampfer, BOKU Vienna, Austria.
The project-time was from November 2021 until March 2024.
Special | A | B | C | D | E | F | G | H | I | J | K | L | M | N | O | P | Q | R | S | T | U | V | W | X | Y | Z | ALL
S |
|---|
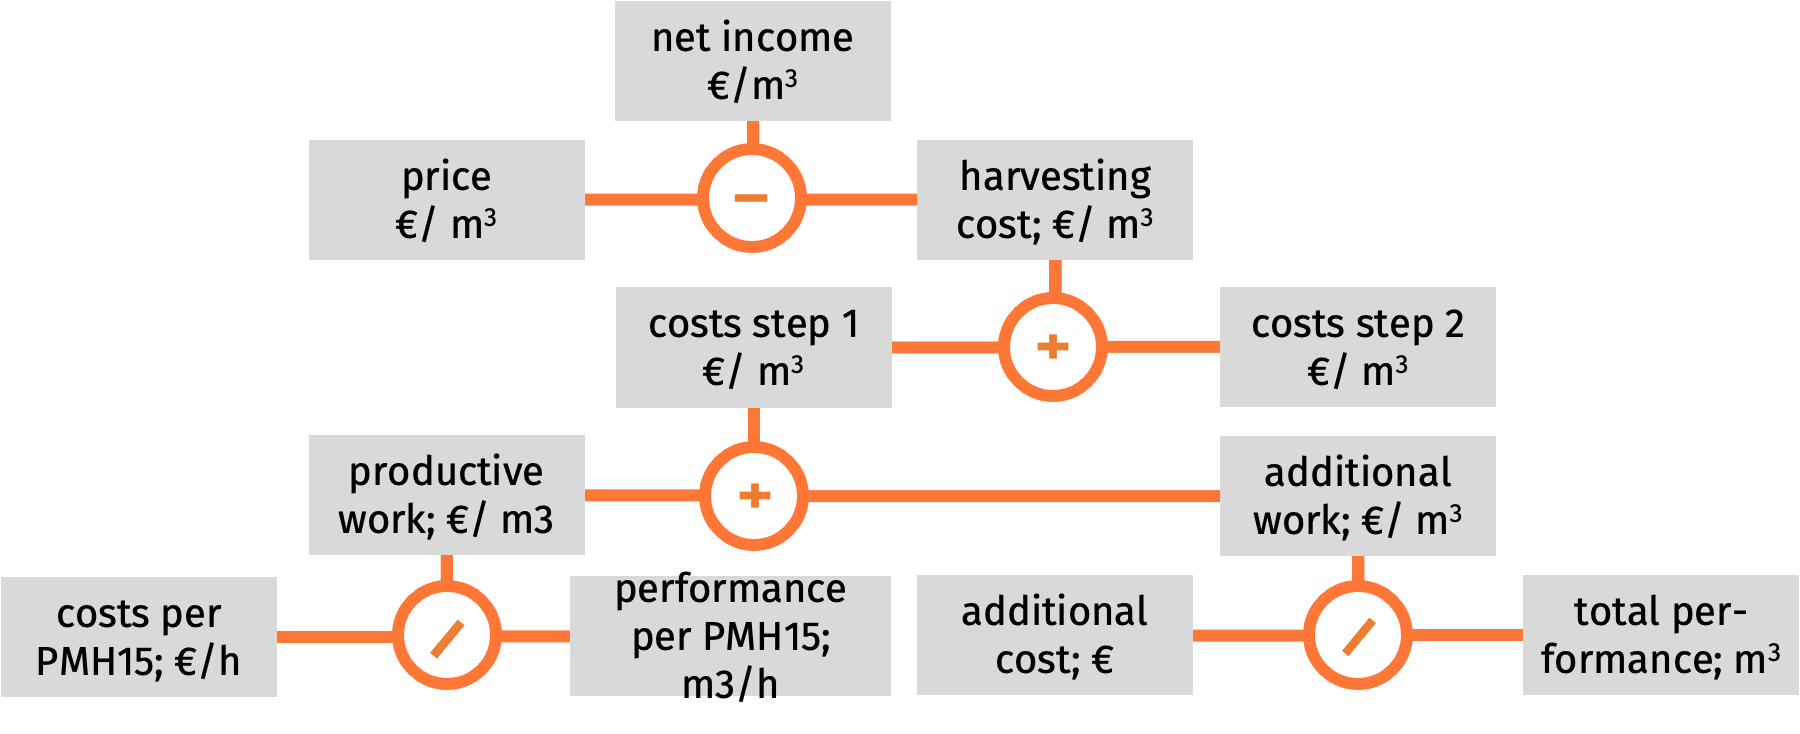
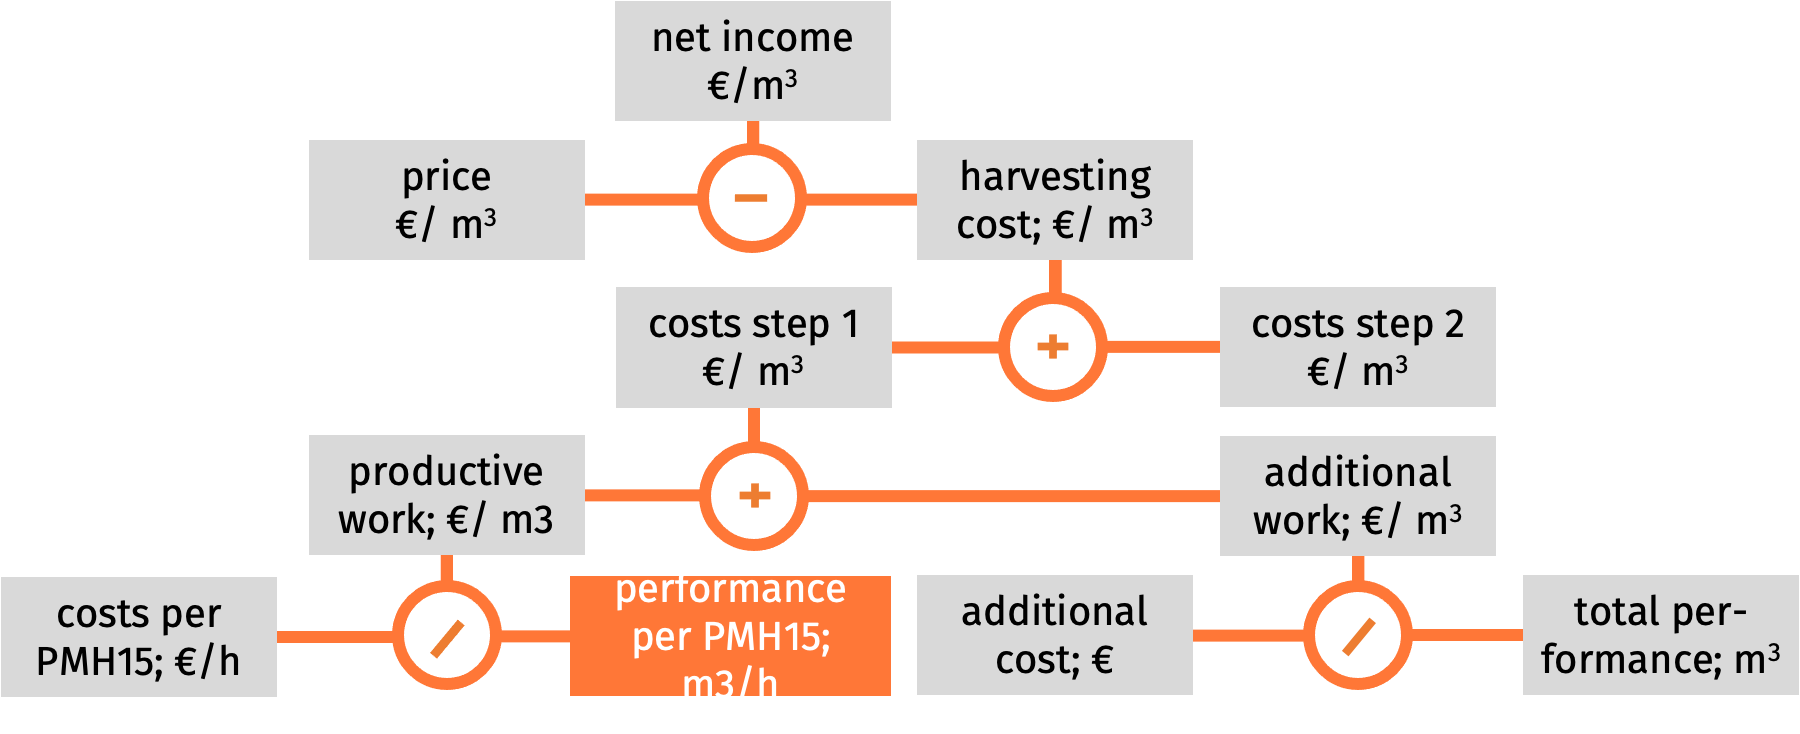
System costsWhen we sell timber on the market, we receive the price of the logs. But we also invest some money to harvest the trees and transport the logs. So only the difference between price and costs, the net income, is available for the company's profit. Let us assume here, that the price only depends on the qualitative and quantitative attributes of the harvest. Thus, the income mostly is influenced by the system costs. To maximize the income, we need to minimize the total system costs. Since most harvesting processes are composed by two or more sub-processes, the costs of a total process are given by the sum of the costs of its constituent sub-processes. But the machines and the operators are charged at an hourly rate. Given this information, we must first calculate the costs per hour. In science, we call this hour PMH15 that means productive machine hour including short interruptions of the work up to 15 minutes. To do this, we use the engineering formula. In that working hour, the system will process a certain number of products. The ratio between products and time is called system performance. When we know the performance, we can match the costs per hour to the production in order to get the costs per unit of a product. For timber harvesting, we need to divide the costs per hour by the productivity, that is: m3 per hour. 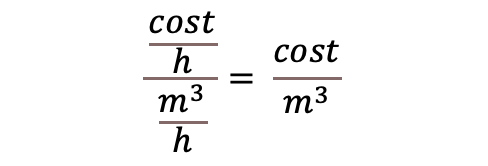
Machines and employees cost money, whether they work or not. This means that the system will generate a cost even when it is not producing anything. Those additional unproductive times (i.e. more than 15 minutes per hour) and costs that are necessary to production (maintenance, preparation etc.) must also be accounted for. To do this, we add all additional costs and divide them by the total sum of m3 on that specific working site. Finally the costs of the sub-systems must be added to find the total system costs. (See more at TDiv PR1-C01)
| |
System costs per hour | |
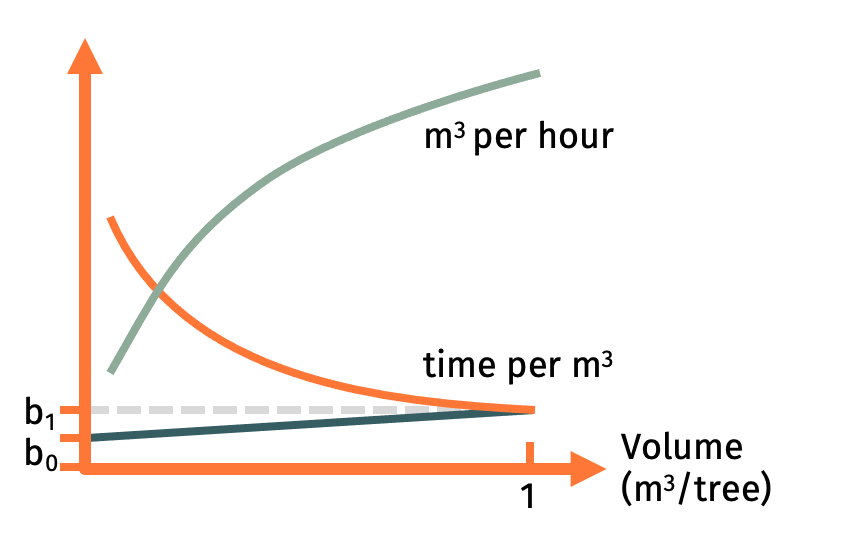
System performanceSystem performance is the productivity of a working system in products per hour. In forest harvesting, normally the products are not indicated by the trees, but by the cubic meters (m3) that are harvested per hour. The performance of a working system depends very much on the attributes of the working object. Besides the tree species, the dimension of the harvested trees has a high influence to the productivity. In scientific publications about working systems, performance is normally represented by a typical curve (green line): • It is low for smaller work objects (in our case: trees) • It increases with the work object size according to a non-linear degressive trend. Some graphs also report time consumption in minutes per cubic meter (red curve). Again, we recognize a typical curve: • Time per cubic meter is higher for small trees compared with big ones • The trend is degressive. This system behavior is known as the principle of tree volume. The time to process a given work object increases, but not as much as the volume of the object increases. The problem is that we know this overall trend, but we don’t have the exact parameters case-by-case. This makes prediction difficult and laborious. In Technodiversity, we suggest a simple solution: Scientific experience has shown that the time consumption per tree depends on its volume according to a typical relationship: • The bigger the tree, the longer the time needed • The data cloud can be well represented by a linear regression • The regression line crosses the y-axis above the origin. Of course, in scientific case studies different curve types will offer a better fit, but the linear function is fairly good, too, and gives us the chance to get an overall estimation of the performance. This general assumption makes it possible to forecast the system performance even with very few data points. Provided that we can accept the linear approximation, we can describe the relationship between time per tree and tree size with the equation just below:
The time ti is composed by two summands: b0 is the fixed time required for processing one single tree. It does not depend on the size of the tree. It is typically the time to walk to the tree, clean the area around it etc. b1 is the time required for processing a single tree. It depends on its size, so we say it is variable. b1 indicates the time consumption at one tree that has exactly the volume of 1 cubic meter. Is the tree smaller, let’s say only 0.5 m3, than the product of b1 times its volume vi is also 0.5 compared with 1 m3. Given this basic line, the time per m3 is
with
This curve ti,m3 includes our two independent variables b0 and b1 with the consequence that it looks different for each working system. Now, dividing 60 min/h by the time consumption ti,m3 we get the performance in m3/h
with
and It shows the typical degressively increasing curve of performance (green): • the bigger the average tree the higher the performance per hour • but the increment gets less and less. • Why do we need to complicate our lives by tracing the process all the way back to the time consumption per tree? • Because that way we get to the original source of time consumption. • We know that the relationship between time consumption per tree and tree size can be represented by a linear regression with two parameters b0 and b1. Those two parameters contain all the information that we need. • To find those parameters, very few time measurements are enough. • We can also modify the two parameters of the regression formula for rough forecast purposes: • When we see, that in our case the preparation time b0 per tree is higher than normal (because of thornbushes, slippery ground etc.), we can “correct” this parameter with a best estimate. • When we know that our operator is quicker than an average operator, we may adapt the parameter b1 to his performance level. (See more at TDiv PR1-C03)
 | |


System productivitySee system performance | |
T |
|---|
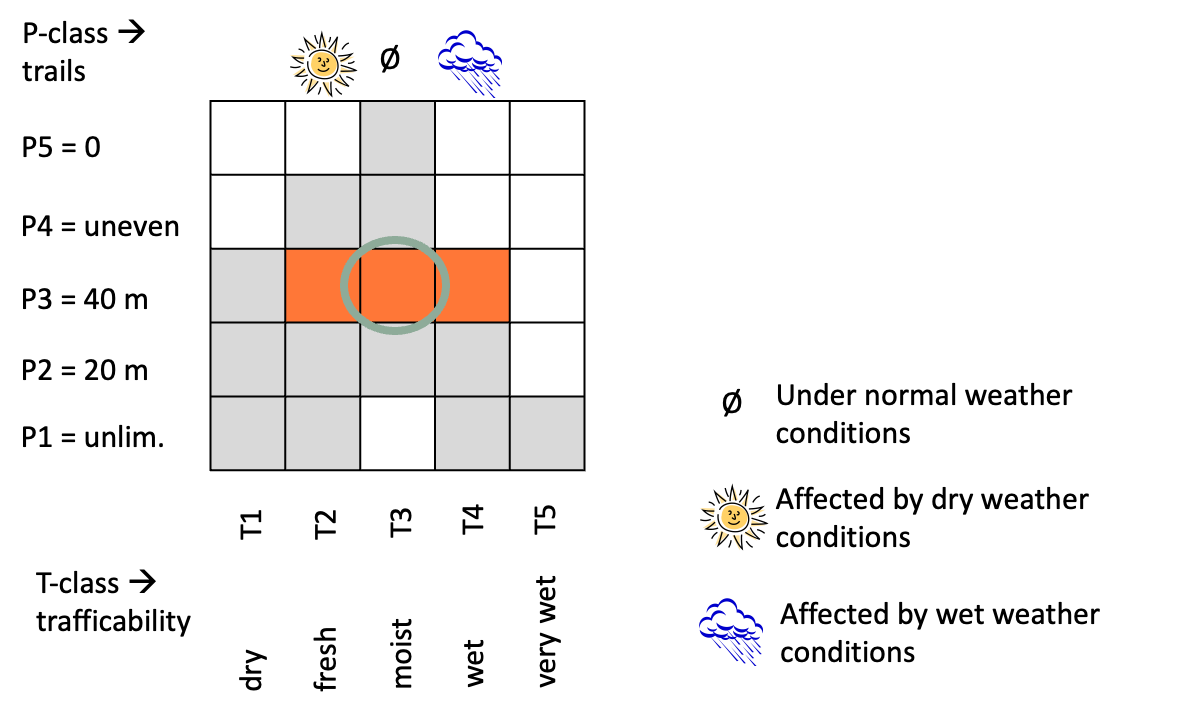
T-classes for trafficabilityIn several countries, there are systems to prevent forest soil from destruction by forest operations. One example is the Saxonian technological map where the soil conditions are divided into 5 trafficability classes. In Technodiversity, the technogram of a stand as well as the ecogram of harvesting methods have as their x-axis the T-classes. They are seen as crucial criterion how much the soil will react to any technical impact. This is the scientific context of traffic on bare grounds. As the guiding criterion we take the soil moisture and divide it into 5 trafficability-classes. Dry (T1), fresh (T2), moist (T3), wet (T4) and very wet (T5). These classes correspond with the assessments of soil sciences. (See more at TDiv PR1-D04) | |
TechnodiversityTechnodiversity is a made-up word that 2021 has been selected as the name of a European ERASMUS+ project (project No. 2021-1-DE01-KA220-HED-000032038). The objective of this project is to point out the diversity of technological solutions in forestry to fulfill the operations under diverse conditions and objectives. Following the principle of biodiversity, the word technodiversity assigns a high value to the variety of solutions and opposes the unified application of standard solutions. The aim of the project is an E-learning course for forest students on master’s level and for decision makers in forestry. This course aims to explain how to select the most suitable harvesting technique for each given case with its specific ecological, economic and societal conditions. It gives to the decision-making process based a transparent path based on clear and objective elements. (See more in lecture TDiv PR1-A01)  | |
")
")
Technogram of a forest standIn Technodiversity, the technogram of the stand is a central element for decision making, which forest harvesting method will fit to the local stand conditions. It has the same structure as the ecogram of the harvesting methods. When both graphs match the methods is well suited for the given stand. The structure of the technogram is a 5x5 matrix with the T-classes as X-axis and the P-classes as Y-axis. The T-class is given by the natural conditions of the stand.Concerning the P-class, the owner can decide for himself about the value of the stand. The higher the value, the higher the costs for technical actions that he accepts. This represents the idea of “sacrifice”. As a principle, all 25 fields can be selected.But if the owner decides that for him the value of a forest stand is correlated with its biological productivity, then some combinations of P-classes and T-classes are quite unlikely (i.e., dry and very productive, wet and very productive, moist and not productive). Under this condition, only 16 “fields” are filled up. Let us take an example:A decision maker sees that the soil in his forest is moist. So, the T-class is fixed at T3. In addition, the stand has a high productivity. He may personally decide that this productivity is so important for him, that he doesn’t want to sacrifice more than 10% of the soil. So, the distance between the trails must not be less than 40 m.In the graph, he localizes this stand at the field T3P3 (see the red ring). Unfortunately, this is an assessment only for normal weather conditions. In case of a dry weather spell, the moist soil may dry a bit and behave like fresh soil. So, he should move one column left (sun symbol) to T2 “fresh”. And when it has rained for several days (rain symbol), then he moves one column right to T4 “wet”, because the soil, which normally is moist, now behaves like a wet soil. 0During this “movement” the system of opening-up, that is fixed by the P-class, does not change. Given this technogram, harvesting methods are searched that match it; this is decided by the ecograms of the harvesting methods. (See more at TDiv PR1-D04) | |
Technological mapTechnological maps have the task to make decisions more operational. For every point they specify the technological conditions and the best method for harvesting, e.g. In 2006, the state forest of Saxony (North-Eastern Germany) introduced a guideline that aimed to forecast the stress on the soil in order to avoid soil damage in advance by suitable harvesting methods. This guideline is based on three main information streams: • soil moisture • inclination of the terrain • sensitivity of the soil. A technological map was developed to make thesethree dimensions transparent for every single stand. With this map, the user can select a working method that fits best to the local environmental conditions. It is binding for all forest officers in the state forest of Saxony. This approach has sparked a heated debate, because it demands to enlarge the distance of the trails from 20 to 40 m as far as the soil has a higher sensitivity. The opponents argue that this will push the harvesting costs without any compensation. So, it prevents earning a decent income in forestry. This Saxonian approach is very normative and can only work inside a state forest or by law. It seems not to be an adequate solution for the European diversity. Nevertheless, we like the basic idea to steer the selection of working methods to those ones that minimize the risk of any damage on the trail. Thus instead, we look for an approach that leaves a maximum of freedom to the decision maker to decide for himself according to the conditions of his region. Therefore, as a proposal, in Technodiversity we suggest a decision-making tool that combines a technogram of the stand with the ecogram of the working methods. (See more at TDiv PR1-D04)  | |
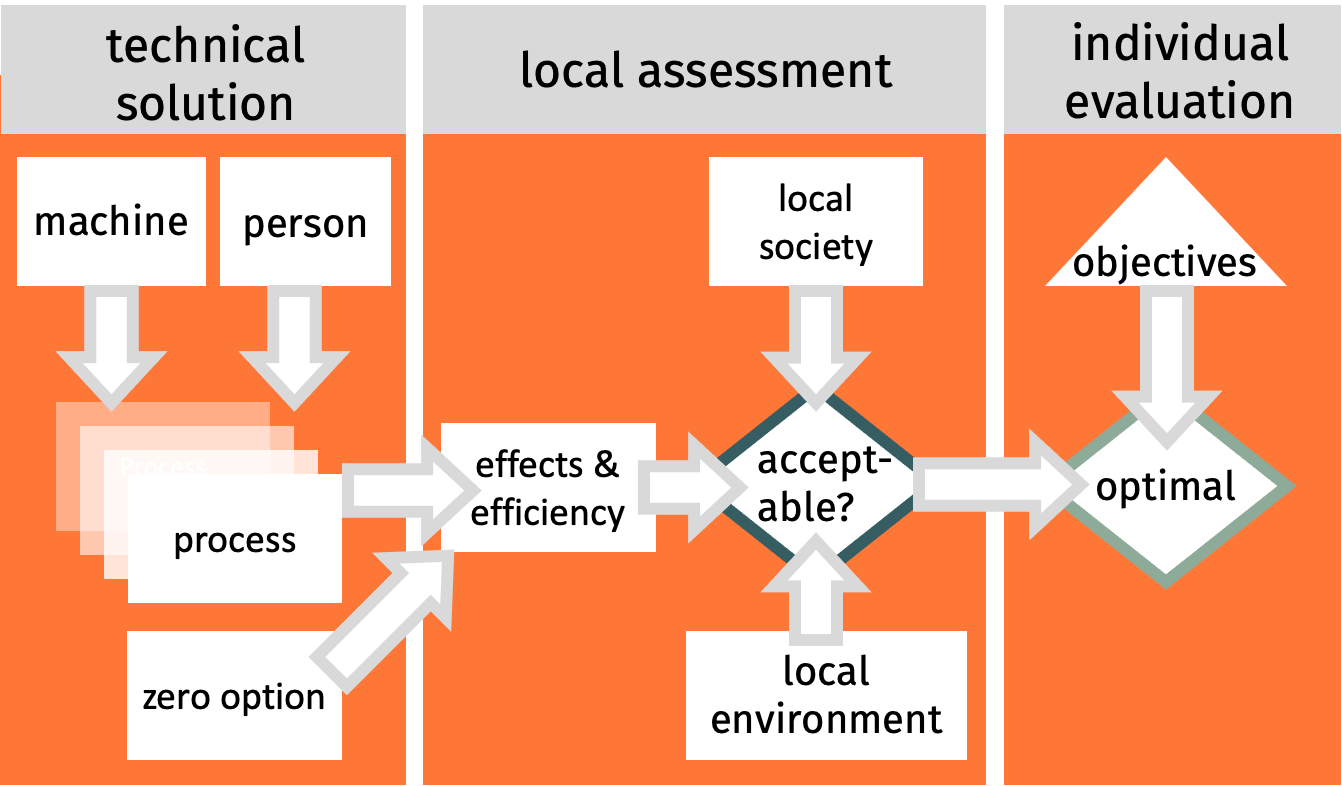
Three-step-modelThe three-step-model of decision-making in forest operations divides the decision-making process into three logical sub-steps: · The first step looks for those technical methods that can be able to do the job that is demanded under the given conditions. These methods are mostly defined by the machines, but the decision-maker should be sure that the operators are available, too, and that the necessary infrastructure for support, repairs etc. is there. It can be recommended to look for 3 to 5 options that are as different as possible concerning different machines, different degrees of mechanization… In addition, one more option should be regarded at every decision-making process: the zero-option, say to do nothing and not to fulfil the demanded job at all. This first step is called the functionalization. · The second step makes the assessment of all options at the background of the given environment and conditions. We call it localization. The criteria are the economic suitability for the company (effectiveness and efficiency), the ecological suitability for the local environment (ecological compatibility and eco-efficiency), and the social suitability for the local population (societal compatibility and ergonomics). If any option fails under one criterion due to official rules or laws, it must be separated from the further decision-making process. · The third step asks for the best option. Since all remaining options follow the rules and laws, the decision-maker is free to select that option that fulfils his individual priorities or preferences in the best way. This selection can be done emotionally without a transparent procedure, so we call this third step individualizing. But there are some decision-making rules that make the way to find the final decision more transparent and reliable. (See more under TDiv PR1-A04)
| |